
Sales analytics at one time was a tedious and intense effort. But today, with advanced tools and software, most of the work is automated and streamlined.
“Data is a precious thing and will last longer than the systems themselves.” – Tim Berners Lee, inventor of the World Wide Web.
With the digitization of most business processes, a massive chunk of data Is generated daily. This data is a goldmine of information that leverages the success of a business. If you harness the power of data, you can gain critical insights into your customers.
Sales analytics helps you make data-backed decisions. Analytics enables one to make better forecasts, carry out predictive analysis, close gaps in performance management, and better sales performance.
In this article:
What is the Meaning of Sales Analytics?
Sales analytics is using your sales data to optimize decision-making in sales. It generates actionable intelligence using trends, insights, and stats to improve overall sales performance. Sales analytics is the key driver in predicting future trends and forecasting sales revenue.
This form of analytics runs on curated data captured from the customer pipeline and sales funnels. Then, the data is segmented in terms of KPIs and metrics. But it can be a challenge to log every data into the CRM as sales reps need to focus on selling activities.
A more formal and in-depth definition comes from Gartner:
“Sales analytics is used in identifying, modeling, understanding, and predicting sales trends and outcomes while aiding sales management in understanding where salespeople can improve. Specifically, sales analytic systems provide functionality that supports discovery, diagnostic and predictive exercises that enable the manipulation of parameters, measures, dimensions or figures as part of an analytic or planning exercise.”
Types of Sales Analytics
Sales analytics is a crucial activity of sales operations and is categorized into four groups:
Descriptive - The What: Involves collection of past sales-related data that helps understand overall sales progress. This sales analytics uses summarized points depicted by graphs and charts—for instance, the decline in sales for product X in region B last year.
Diagnostic - The Why: This sales analytics gathers the critical drivers of past sales performance. In this step, you look at why the sales spiked or declined. It also includes giving possible explanations of the past trends and using data mining to uncover the root cause. Example: Competitor’s product is pushing product X out of the market because of low customer retention.
Predictive - The Future: This type of sales analytics forecasts future scenarios. Compiled data is fed into the program that predicts the future based on past trends and stats.
Prescriptive - The Plan: After receiving the predictive results, now is the time to devise an effective strategy. Sales managers propose key action items and a game plan to direct the reps towards the goal. It also involves understanding the potential effects of the decisions.
Who can use Sales Analytics?

Sales Operations and Managers: Sales operations team is mainly concerned with data compilation, data accuracy, and forecasting. Using sales analytics can help operations in managing an updated CRM with the latest entries. It also reduces pipeline preparation time, identifies deal risks, and automates reporting from a single data source. Thus, sales analytics ensures GTM teams are on the same page during the entire process.
Marketing: Automated CRMs capture every data that can be used between different teams. The data brings marketing, sales, and customer success together to close deals. It offers insights into deal risk so that marketing can adopt ABM strategies accordingly. Further, it shows the influence of marketing over sales.
Finance: In-depth insights and trends help the finance team manage and allocate budgets. The key revenue metrics give the CFO a better understanding of the forces at play.
Sales Analytics Use Cases
According to a Mckinsey survey of more than 1,000 sales organizations around the world, “53 percent of those that are high performing rate themselves as effective users of analytics.”
The report reveals that fast-growing companies use robust sales analytics more effectively, but “most companies struggle.”

Forward-thinking companies are leveraging data and sales analytics to increase value creation for B2B and B2C domains. Following a sales analytics guide offers you valuable insights into the KPIs and brings more accountability. With that said, here are the core areas where sales analytics brings the most value:
- Reduction of Non-Selling activities: Surveys have shown that sales reps spend most of their time on non-sales tasks, with only 37% time spent in selling. This includes feeding data into the CRM, making sales forecasts, identifying leads, and prioritizing the converting leads. Sales analytics software can effectively manage and accomplish these activities with little human intervention.
- Increased Revenue: Sales analytics software identifies the weekly, monthly, and quarterly sales revenue. This provides insights into what’s going right or wrong. The gap between the tactics and the results can be identified quickly to bring more revenue.
- Better Sales Performance: Sales analytics guides the managers through the entire sales pipeline and performance. Managers can use these insights to identify the performance metrics of each sales rep and identify the gaps, if any. These can also build a basic standard process that the sales team can follow.
- Helps in Sales Planning: Accurate forecasts can help executives plan better for the future. Taking into consideration the critical activities and drivers, they can devise a robust strategy. Understanding factors like geographic, demographic, industrial, etc., helps in allocating sales budgets.

- Improved Lead Generation: One of the prominent sales analytics use cases is identifying the right lead at the right time. Organizations use a wide range of software to deploy holistic strategies to identify and track prospective customers. Some companies even embed scoring algorithms to capture high-performing leads. A report by Mckinsey suggests that sales data analytics can result in better resource allocation, thus increasing lead conversion rate.
- Analyzing Customer Sentiment: AI in sales helps in customer feedback. AI gathers information conveyed by customers and the semantics of the conversation. It enables the organization to understand customers’ perception of the brand.
- Optimized Up-selling and Cross-selling: Selling to an existing customer base has higher chances of bringing increased revenue. Sales analytics helps sales managers in crafting effective cross-selling and up-selling strategies. It also helps identify key value items, categories, popular products, and high-demand products that impact the sales bottom line.
Limitations of Sales analytics
Compatibility: Sales analytics is useful in organizations that fulfill these criteria:
- At least ten sales reps.
- Sales in tens.
- A stable product and target market so that consumer behaviors don't vary drastically over a short period.
If your sales data easily fits into the spreadsheets and what you’re offering changes every day, using sales analytics might be a costly proposition.
Hard to Predict the ROI: A significant challenge in using sales analytics is that it is hard to measure its effectiveness relative to the efforts put in. It is difficult to find out how much time it saves for the sales rep and how much it improves sales revenue.
Data Security and Privacy: Some organizations worry about their data privacy when considering sales analytics software. It is a fact that AI algorithms run on a massive chunk of data. Thus, it should be the decision makers’ choice what data they are willing to share with an analytics tool.
Guide on Sales Analytics Software
The Difference Between Multiple Sales Analytics Software
Sales analytics can be differentiated in terms of how it uses artificial intelligence and how it is integrated within your systems.
- Some sales analytics solutions are integrated with your primary data system (email, SMS, calls, etc.). They capture real-time sales data and activity and condense the information to aid forecasting. AI in sales can help identify and reduce time-wasting tasks to boost overall productivity.
- Sales analytics can be integrated with other software. For instance, SalesForce CRM provides integration for engagement, enablement, solutions, etc. Also, the CRM captures data to refine predictions and make the pipeline efficient.
- Lastly, there are sales analytics software that provide state-of-art data visualization functions. These offer options to view data in the form of graphics, stats, charts, and tables. For instance, Power BI is an excellent business intelligence tool that companies leverage to draw an image with the data.
How to Choose the Perfect Solution for Your Organization?
There is no one-size-fits-all sales analytics software. Based on your company and its organizational goals, the optimum solution will vary. These are the parameters that you should evaluate before buying a sales analytics solution:
Size of the Company: Large organizations have several sales teams that use their own forecasting methodology. This results in ambiguity in the final results as sales estimates don’t exactly match. The better approach is to use a standard system so that the entire sales team works under one hood. Thus, sales analytics software are perfect for companies with:
- More than 30 sales reps.
- Stable product and sales.
- Consistent target market.
- Consistent consumer behavior.
Business Requirements: Before investing in a solution, businesses should figure out why they need a solution.
- Inconsistent and incomplete data fed into CRM.
- A large amount of time spent in recording sales activity data.
- Lots of manual work in sales forecasting.
- Ambiguity and mismatch in the forecast between different teams.
- No transparency of forecasting methodology across sales teams.
- Poor view of the pipeline tasks and activities.
- No universal source of data to depend upon.
Ease of Integration: Entire organizations need to adopt the new software whenever it is deployed. This means restructuring the past data or gathering new data for the software. Further, existing systems should integrate with the sales analytics tool to streamline workflow. Investing in sales analytics software requires adequate planning.
Purpose of Solution: One type of software offers only specialized functions of sales analytics, e.g., data visualization. The other variety of software is CRMs that offer sales analytics as an additional feature but is built for pipeline management. You’ve to dig into what sales functions have a bottleneck due to insufficient resources or time. Then you can deploy the required sales software that streamlines the process.
How to Perform Sales Analysis
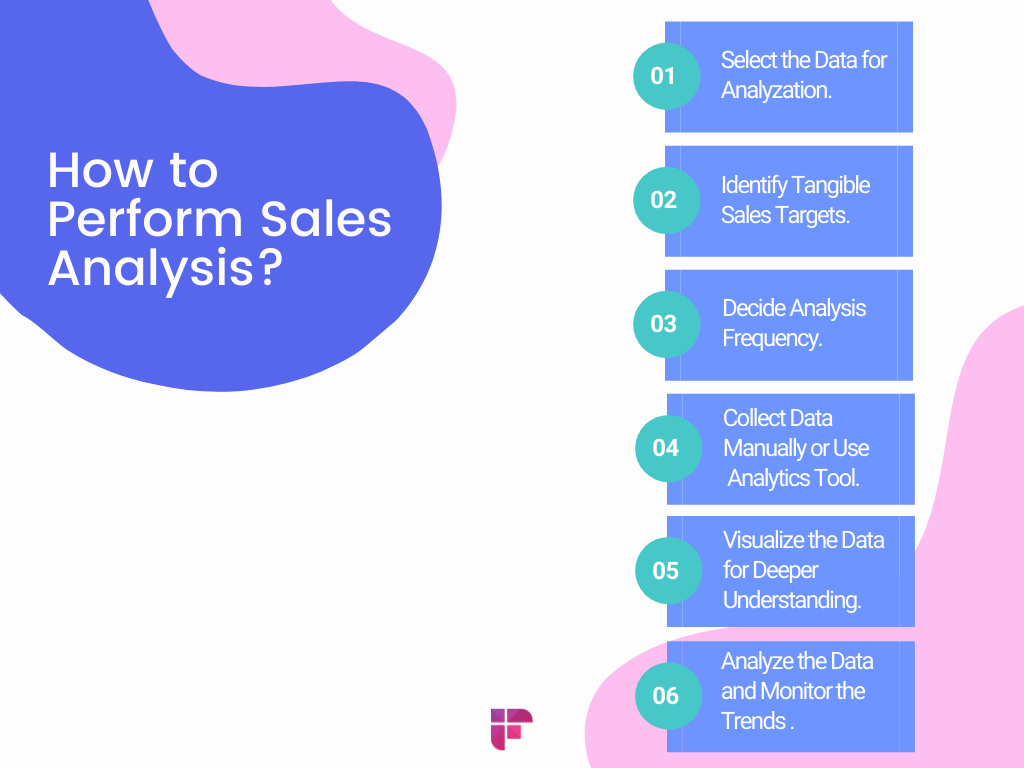
1. Select the Data for Analyzation
Before starting a rigorous analysis, it’s better first to select the data. There are many types of sales data, e.g., market forecasts, accounts, contacts, leads, activities, quotes. Knowing your motives beforehand helps clear the end goal. Once you understand the core domain, you can get deep into it.
2. Identify Tangible Sales Targets
The domain gives you a vast quantity of information to choose from. Now is the time to zero in on the tangible objectives. Something measurable and definitive. For instance, if you have a garments store and are offering a 55% discount on some of the merchandise.
Now you want to measure how your sales spiked and which products performed the best. You can measure the performance of your offer in terms of product sales per unit during and after the campaign.
3. Decide Analysis Frequency
The frequency of analysis depends upon the nature of data analysis. For some products, you’d be analyzing daily data, while for others, it could be monthly or quarterly. In our last example, you’ll need past data as a reference point for future sales analysis over a time period. This infers that you should decide a frequency based on when you collect the past sales data.
4. Collect Data Manually or Use a Sales Analytics Tool
Compiling data manually is still a viable option if you use spreadsheets, excel, etc. But this step requires tedious work, so you might want to switch to a sales analytics tool to save time. Modern CRMs are excellent in compiling data with great accuracy and consistency. They also offer updates about individual customers and keep logs of sales performance for reviews.
TIP: You can integrate your CRM with Fireflies.ai, and all your sales calls will be transcripted automatically. You can then quickly edit, share, search and collaborate on the meeting notes with your sales manager.
5. Visualize the Data for Deeper Understanding
It’s hard to make decisions just by looking at a sheet filled with numbers. That’s where data visualization tools come in. Graphical representation of data offers critical insights to the sales managers. In other words, data visualization allows you to make sense of data to aid decision-making.
6. Analyze the Data and Monitor the Trends
In this step, you’ll compare the results with your sales objectives. Data visualization will make this process more effective as you can see the growth or decline of sales in the graphs, charts, stats, etc. Analyzing the data gives your insights into the efficiency of sales campaigns, strategies, KPIs, and key metrics.
7. Prepare a Future Action Plan
Now that you’ve analyzed the data and figured out what went right or wrong, it’s time to tie it all up. Take what you’ve learned and apply it to direct your future sales efforts. Plan for better understanding and anticipation of customer behavior. This step is crucial because the analysis aims to prepare for the future. Remember, there is always room to excel.
Best Sales Analytics Tools and Apps
1. HubSpot Sales Hub
HubSpot sales hub is a powerful CRM suite that can help create and manage all types of sales reports. The interface is easily accessible, making the transition from one feature to another seamless.
- Sales engagement tools
- Configure-price-quote (CPQ) function
- Robust sales analytics
- Deal forecasts
- Productivity logs
Price: Plans starting at $40 per month.
2. Salesforce
Salesforce is a top choice to aid decision-making based on sales and CRM data. The software is powered by Einstein Analytics and Tableau, which makes data analysis more productive.
- Information Rich Dashboards
- Collaboration Made Easy
- Einstein Discovery
Price: Plans starting at $25 per month.
3. Zoho
Zoho Analytics is popular among other sales analytics software due to its integrative BI features. The tool helps you analyze key sales metrics and sales drivers.
- Chart Creation
- Smart Assistant
- Seamless collaboration
Price: Starts at $22 per month.
4. Salesflare
Salesflare is a popular choice among small businesses selling B2B products. The tool helps sales reps by automatically updating the CRM with accurate data. It keeps track of your conversation across different channels and sends you updates.
- Zero-input pipeline tool.
- Automated customer timelines.
- Automatic reminders so your deals won’t fall through the cracks.
Price: Starts at $29 per month.
5. Power BI
Power BI is an intelligent sales analytics and data visualization tool from Microsoft. The software leverages individual sales efforts and the company’s efforts alike.
- Hundreds of data visualization methods.
- In-built AI features.
- Excel integration.
- Custom and in-built connectors.
- Data loss protection Framework by Microsoft.
Price: Plans starts at $9.99 per individual user
Iterate, Iterate, Iterate
Analysis of sales data can seem overwhelming, but it doesn’t have to be. The process is challenging when your efforts are not focused. But with the right strategy, smart tools, and specific guidelines, sales analytics improve overall sales performance.
Remember that a perfect sales strategy is the one that keeps evolving. Over the years, new market factors, KPIs, sales performance, etc., will be introduced.
Thus, iterating the sales strategy is instrumental in decision-making and taking the business to a whole new level. Ultimately, it can help you achieve your sales quotas and build an army of loyal customers.